FFParam-GUI overiew
This page provides the structure of FFParam-GUI.
Setting Path to External Programs
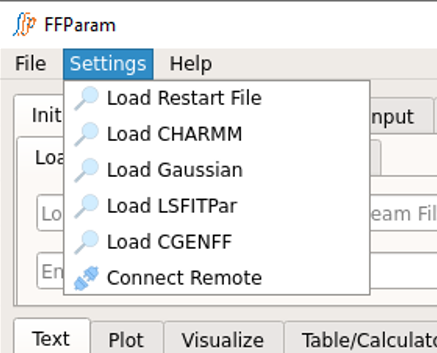
The external softwares which may be required for completing the parametrization process are CHARMM, Gaussian, LSFitPar, and CGenFF. In order to run the corresponding calculation, link the path of executables in Top Menu > Settings.
Supply CHARMM engine path in Load CHARMM, if you want to enable FFParam-GUI to directly perform MM calculations.
Supply Gaussian engine path in Load Gaussian, if you have Gaussian software installed onthe system from where you are launching FFParam-GUI. Note: Psi4 is accessed through the python API so no path is required.
Supply lsfitpar path in Load LSFIT, if you want to auto-fit bonded paramaters. (lsfitpar should be precompiled on local workstation).
Supply CGENFF path in Load CGENFF, if you want to locallly generate resname.str file by supplying .mol2 file. CGENFF program may be obtained from SilcsBio LLC (silcsbio.com).
Use Connect Remote, if you want to run QM calculation on a remote machine through FFParam-GUI.
Other than these, Psi4 and OpenMM can be installed as python packages.
Top Section
Parmetrization Functions
Below is an image of the tabs allowing access to the various functions of the GUI. These tabs allow for creation of inputs, performing calculations, comparing results and manual or automated parameter optimization.
Note
These pushbuttons “ ” located next to lineEditors should be used to browse relevant files.
InitialSystemSetup
Upload essential files to initiate or continue parameter optimization. Must be accessed and “Load” command performed to activate FFParam-Gui in all cases.
CreateQMInput
Tools to create QM inputs for Gaussian or Psi4 that may be run remotely or through the GUI if required.
QMCalculations
Submit QM jobs to Gaussian or Psi4 either locally or remotely.
ExtractQMResults
Obtain various types of information from QM calculations including for both the monomers and monomer-water interactions and prepare the data for force field optimization.
MMCalculations
Run MM calculations using CHARMM or OpenMM including geometry optimizations, potential energy scans and interation energies with water and extract data for force field optimization.
CompareMMvsQM
Compare data from the QM and MM calculations to allow for decisions on parameter optimization to be performed. At this stage users may initiate parameter optimization. This includes manual parameter optimization by modifying the parameter stream file using the text editing capability and then rerunning the MM calculations as well as automated parameter optimization using the Least-Squares Fitting (LSFit) program (Vanommeslaeghe et al. 2015). Automated fitting requires preparation of the LSFit input file under the MMCalculations tab.
Autofit:ChargeAlpThol
Perform automated optimization of the partial atomic charges as well as the atomic polarizabilities and Thole scale factors with the Drude polarizable force field. Optimization can target QM dipole moments, molecular polarizabilities and interactions with water using a Monte-Carlo Simulated Annealing Program.
Autofit:vdwParam
Under development. It is currently assummed that the initial small molecule parameters will include previously optimized Lennard-Jones (LJ) parameters. Information on optimization of LJ parameters based on condensed phase properties may be obtained from Soteras Gutiérrez et al., 2016 or Lin and MacKerell., 2018. Note that it is possible to manually optimize pair-specific LJ parameters (NBFIX) and or through-space Thole terms (NBTHOLE) targeting interactions with the MMCalculations and CompareMMvsQM capabilities.
Bottom Section
Data Access and Manipulation Capabilities
The bottom section of the GUI is designed for displaying various forms of result produced during the parameterization process. FFParam-GUI includes the capabilities to access and modify files, plot data, visualize molecules and visualize and perform calculations on data in Tables.
Text Editor
Designed using Qt-based text editor.
Able to display the utf-8 encoded files.
You can open a file directly in this text-editor by clicking “Open” button or File=>Open File.
The file opens initially in ReadOnly mode.
You can click Edit button to edit the file.
Most of the tabs in the top section direct their output to this text-editor.
Useful in manual optimization of parameters in toppar stream files, alterations of input files and so on.
Graph Plotter
Designed using matplot libraries.
You can compare MM and QM bonded potential energy scans in “CompareMMvsQM” tab. Plots QM and MM PES in same plot.
You can click “Open” to display the plot, if you have a data file containing columns of numeric values.
You can also copy and paste values in the table provided here, followed by clicking “Update Plot” to plot the graphs.
Molecular Visualizer
Designed using PyOpenGL libraries.
The features of elements such as color and covalent radii is as suggested by Open-Babel library.
You can visualize most of the coordinate file formats viz. .pdb, .crd, .xyz, .mol2, Gaussian input, Gaussian output, Psi4 Input, and Psi4 output. (Displays atom names by default.)
You can measure distance, angle and dihedral values by choosing the atoms. (double-click at atomic position to select). The values will be displayed in a pop-up message box.
You can visualize multiple geometries at once in the visualizer by selecting them together. This provides visual assistance in coordinate-comparison. This feature may be exploited to compare qm and mm geometries, various input/output of water interaction files, etc.
You can rotate geometries can be rotated while holding the left-click of the mouse and can be zoomed in or out by scrolling. Translation feature is not enabled in the visualizer as it is not required during the visualization process.
You can visualize custom coordinate files. For example, the Gaussian water interaction input files generated by this package contains involves both cartesian and Z-matrix format in single file. It is a good idea to inspect these starting geometries before going ahead with qm calculation. This visualizer is capable of displaying such complex formats as well.
Table/Calculator
Designed using Qt-table widget.
You can open text file in table form. (Splits string by space.)
You can select a column of numeric values and double click within selected area to get the sum.
You can change the entries.
You can save the table in the form of text.
Useful in ensuring the total charge, when the partial charges on some atoms are changed.